_
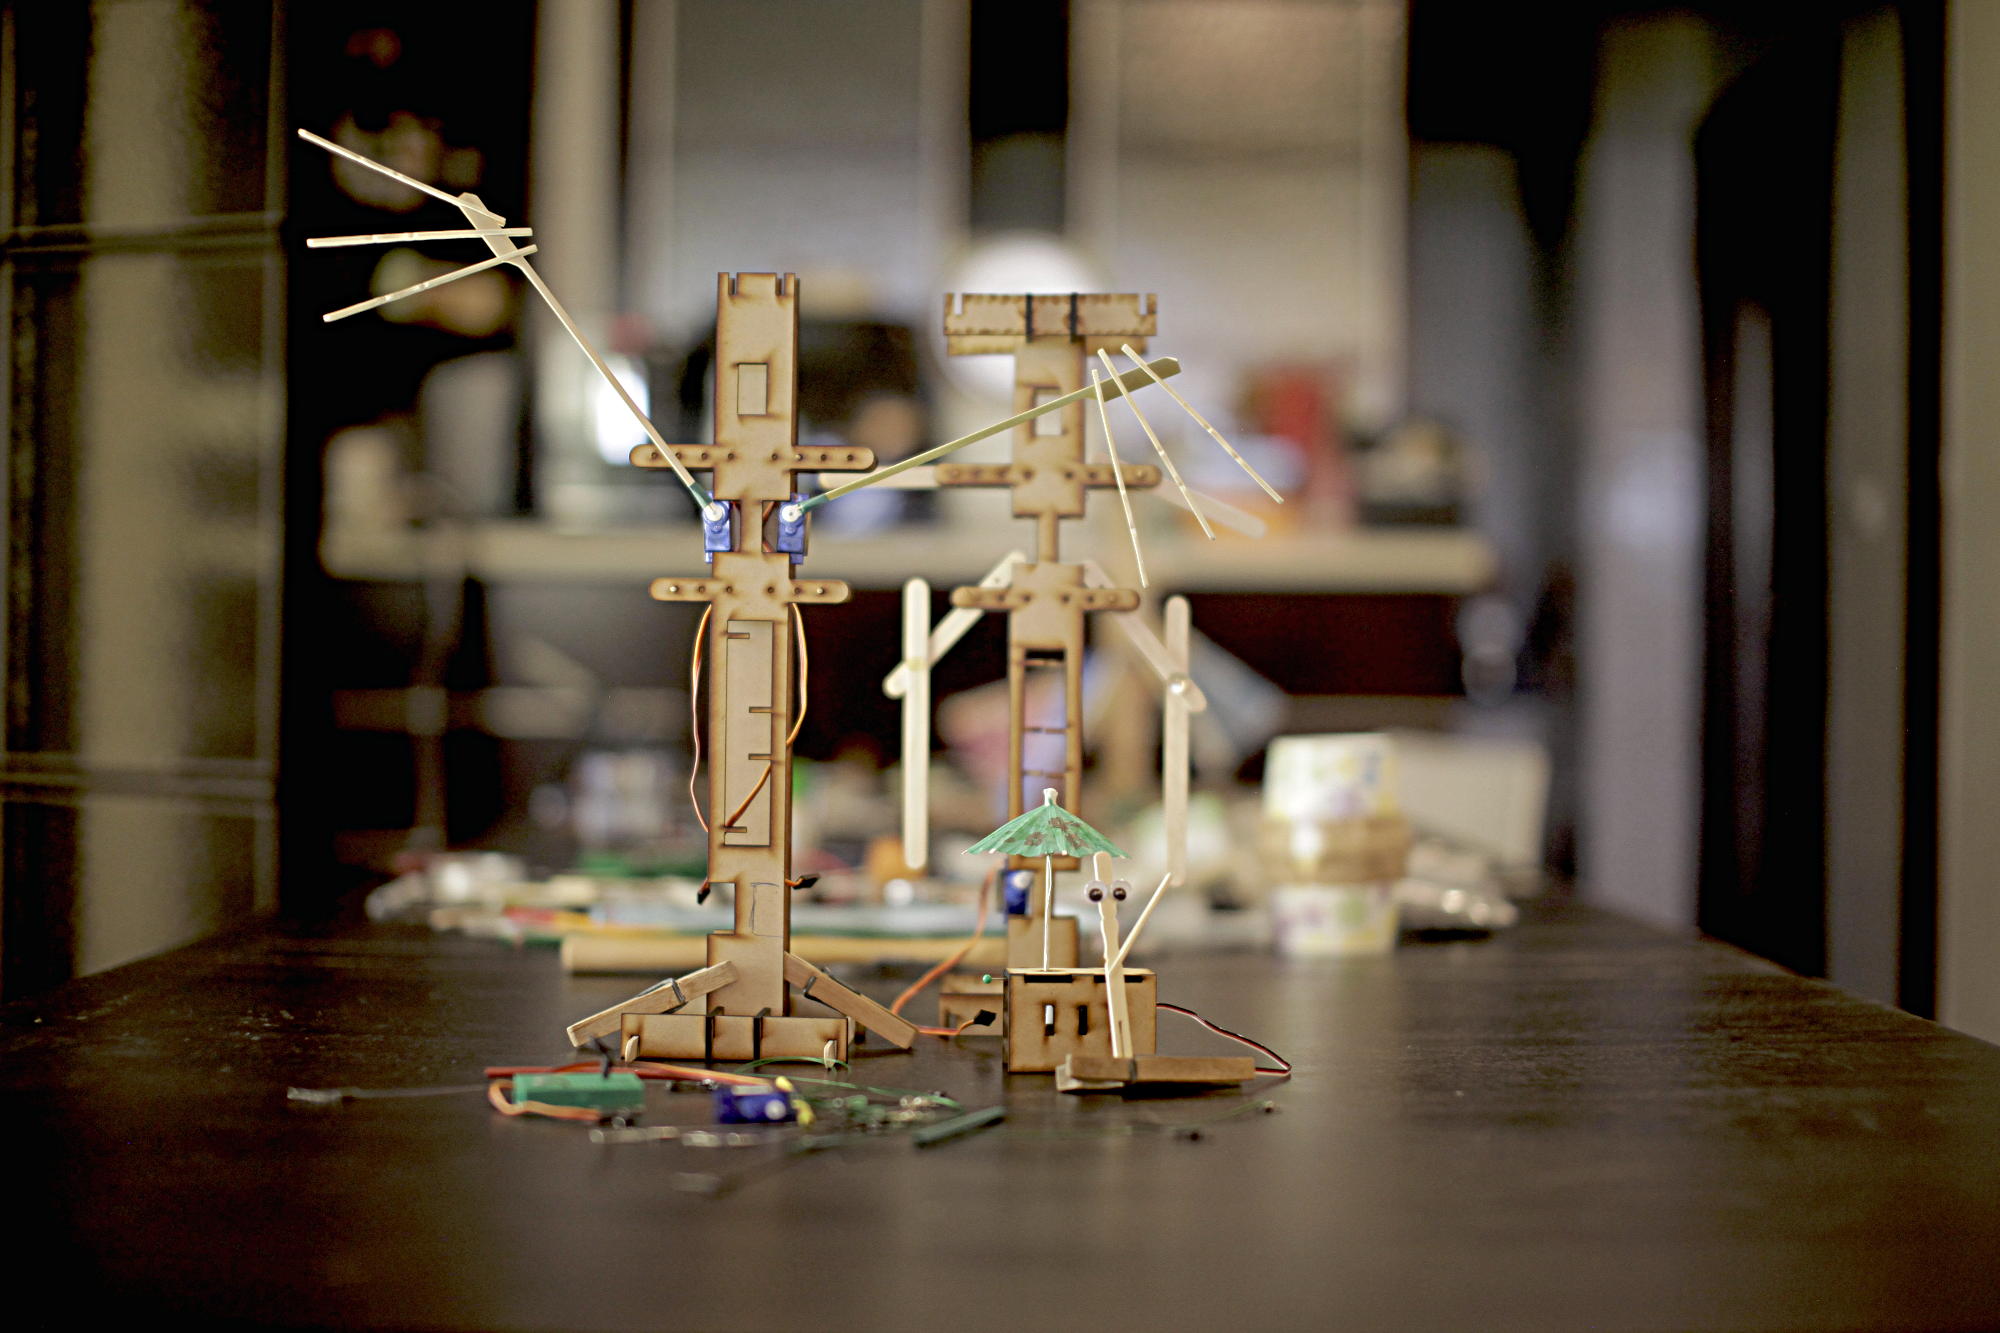
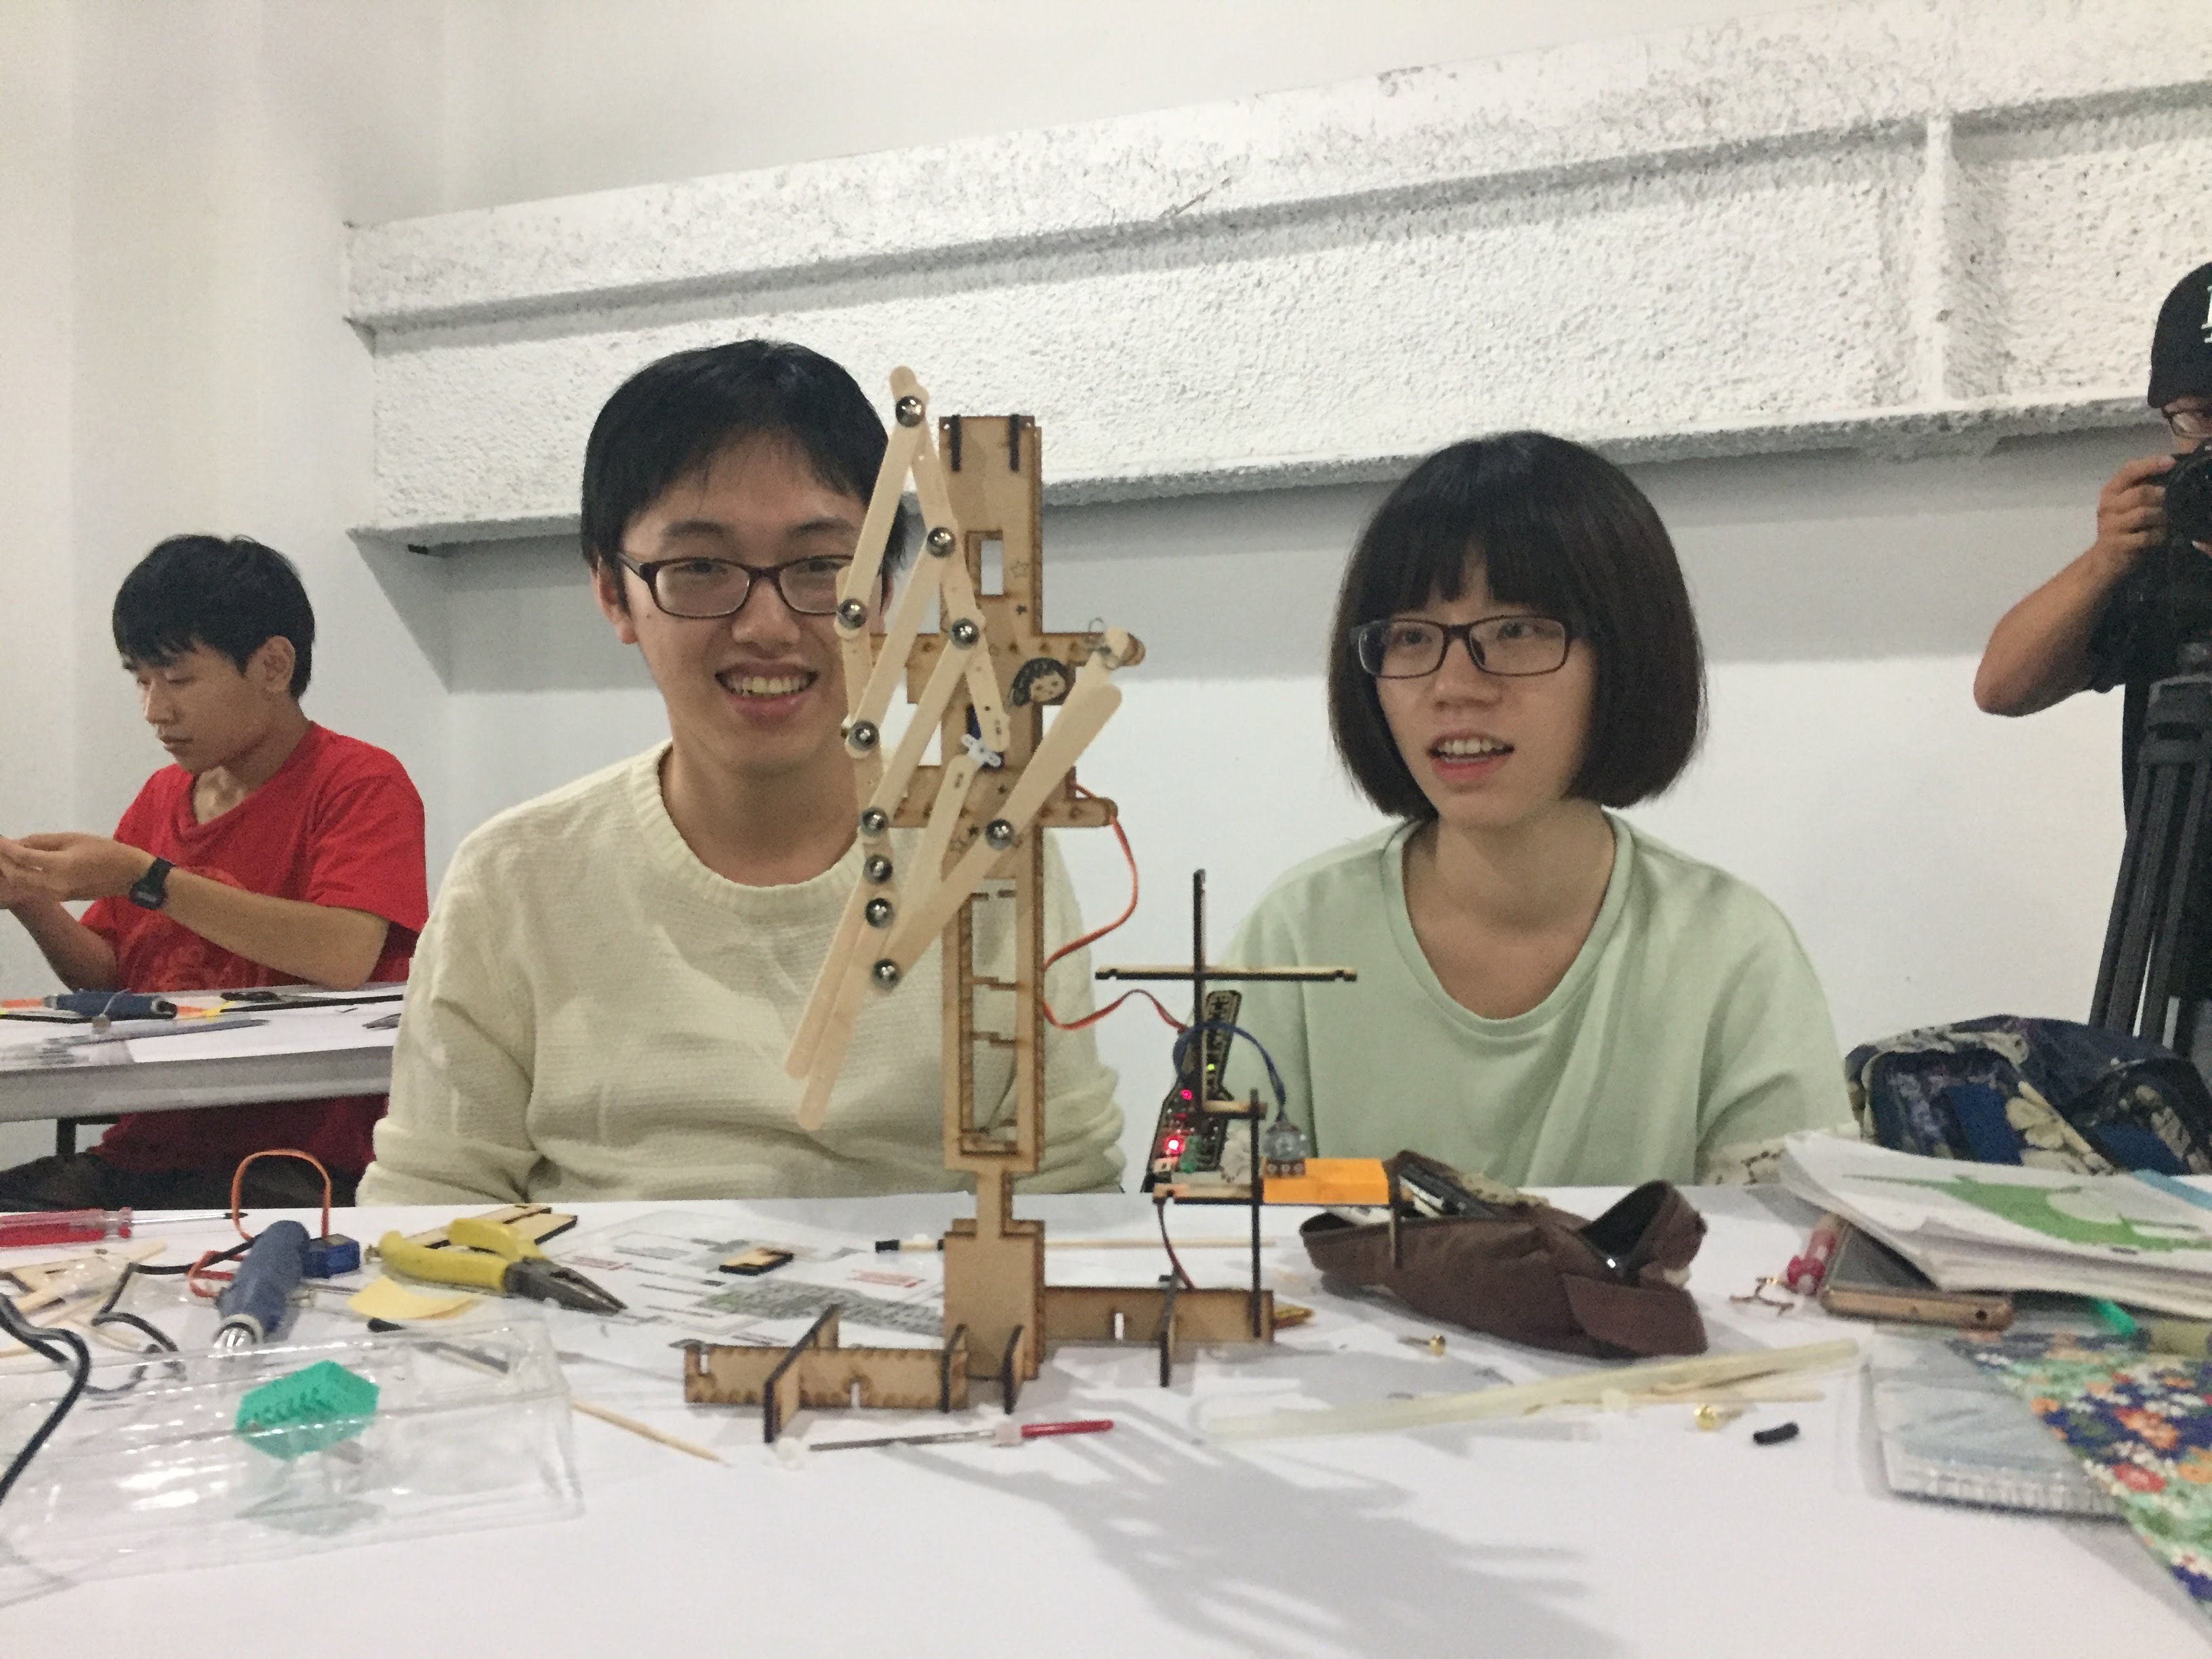
Information Physicalisation
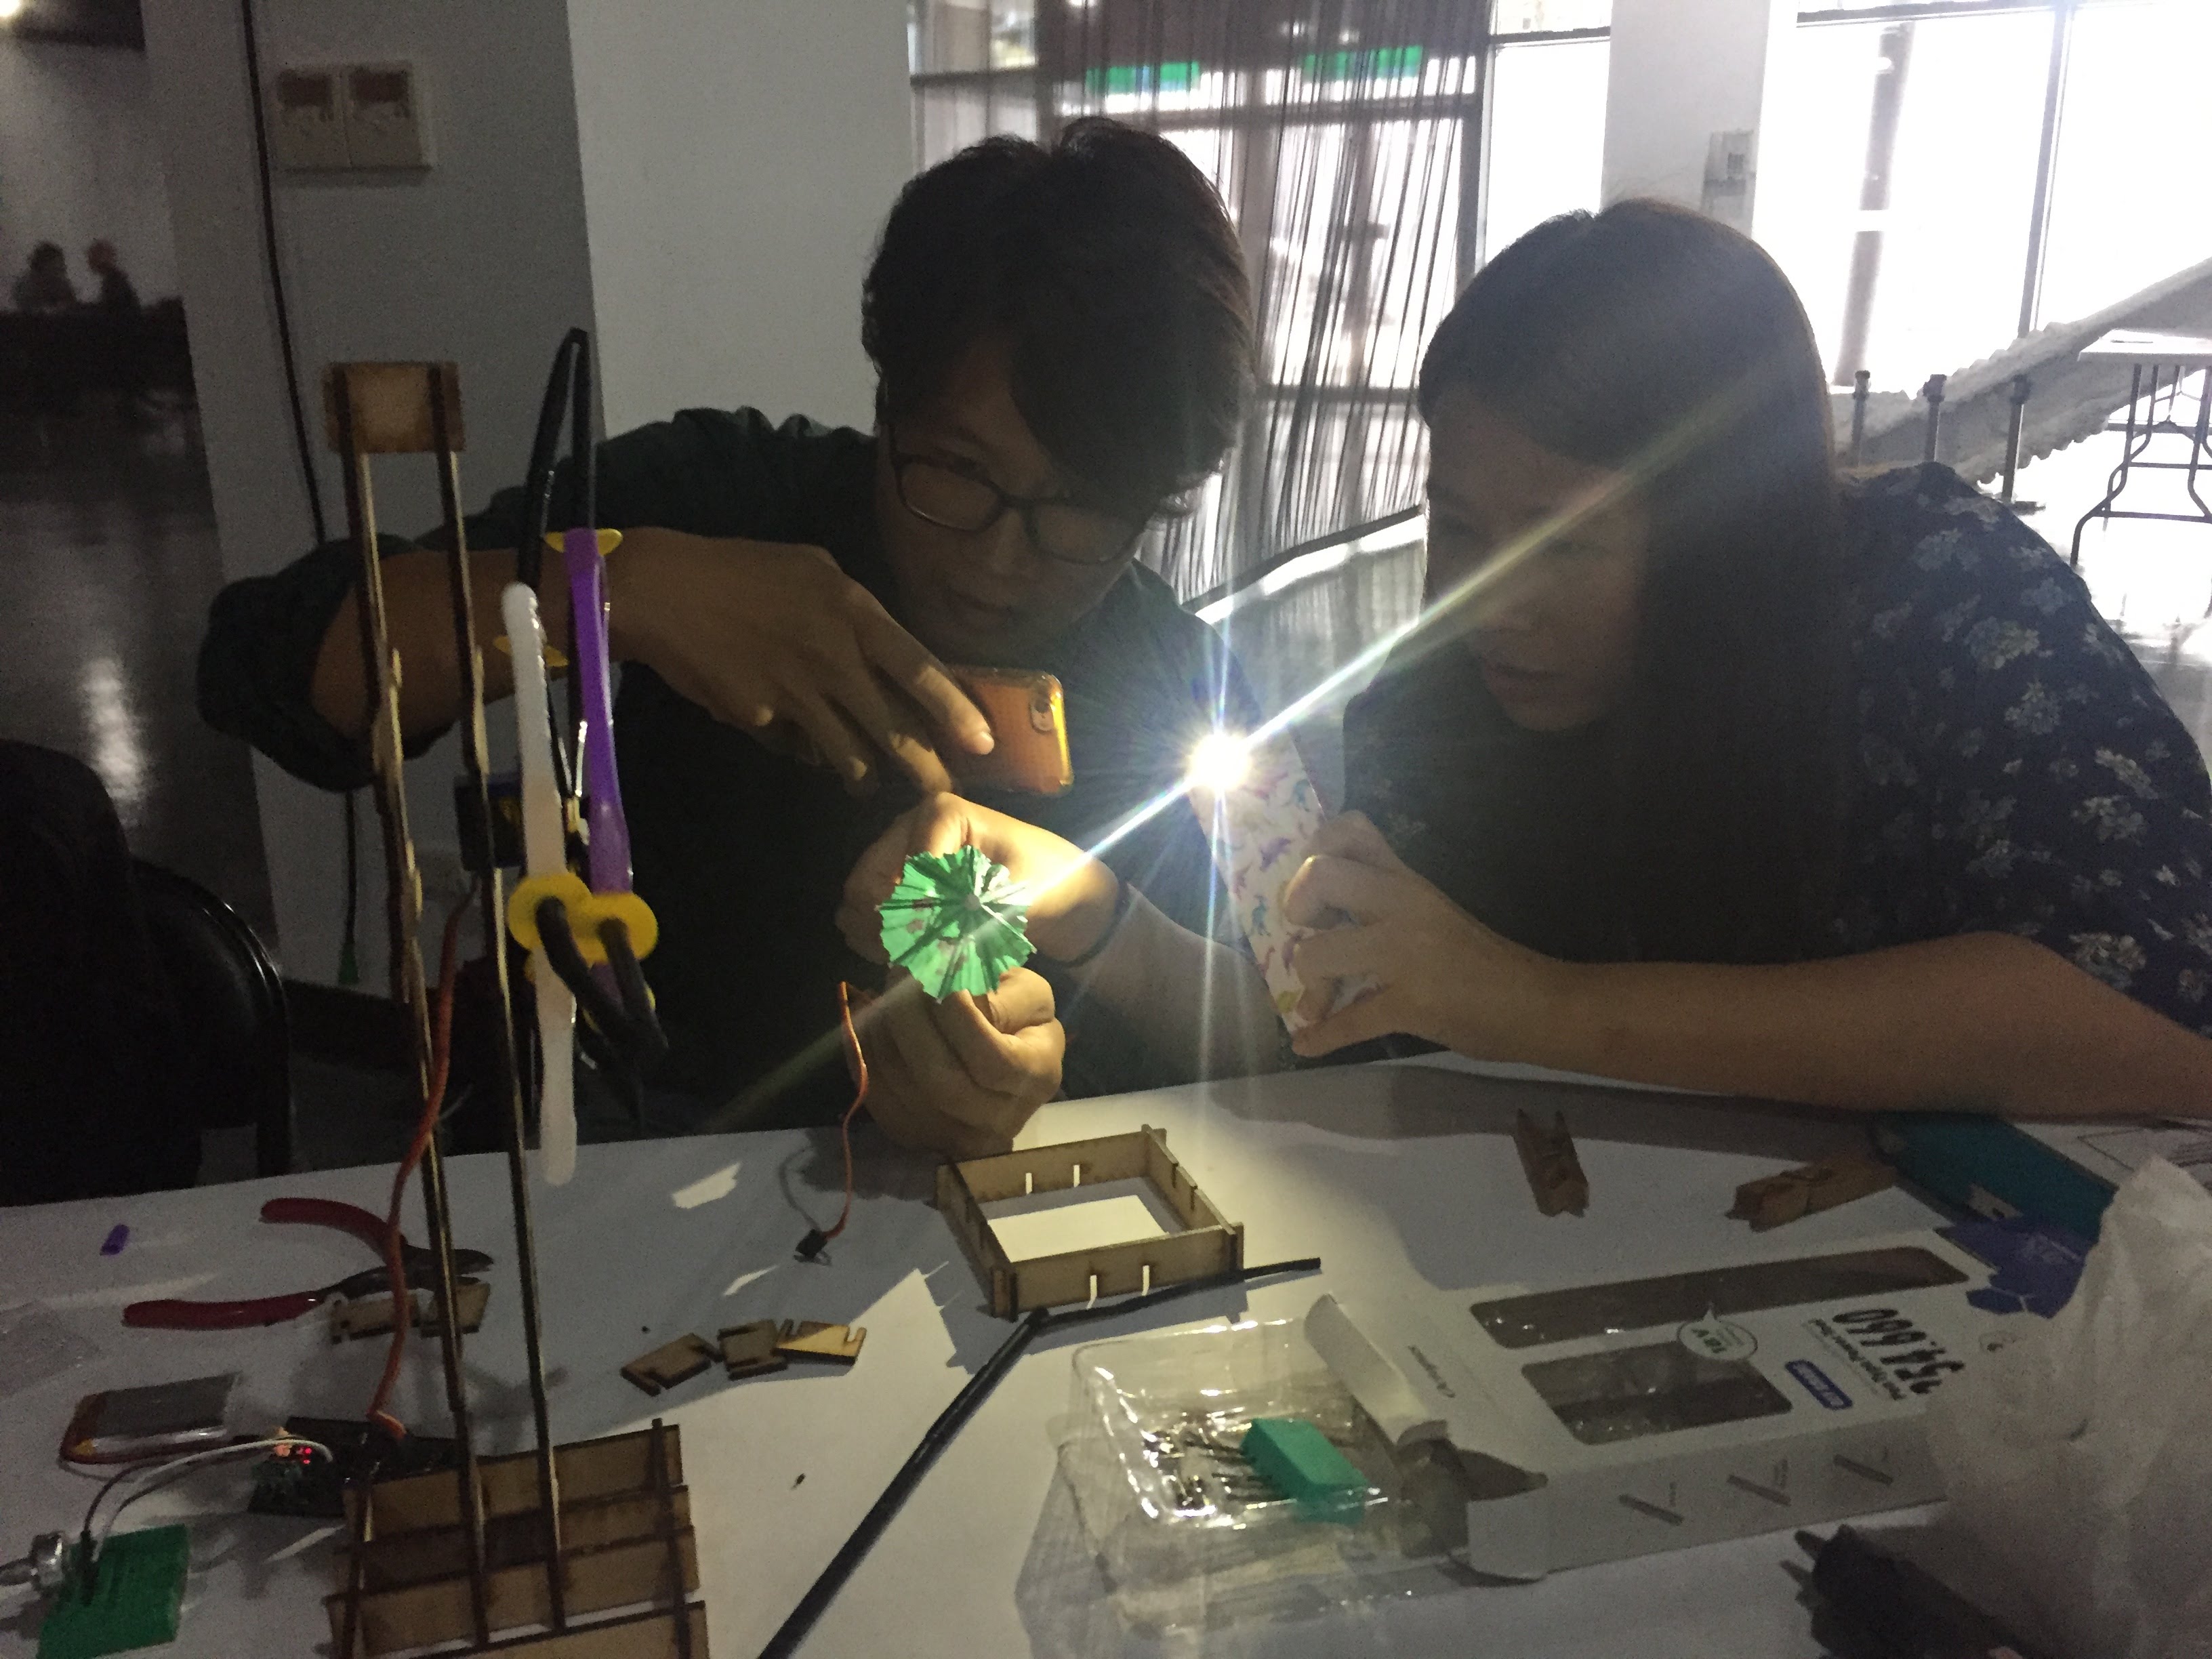
Dancing Data
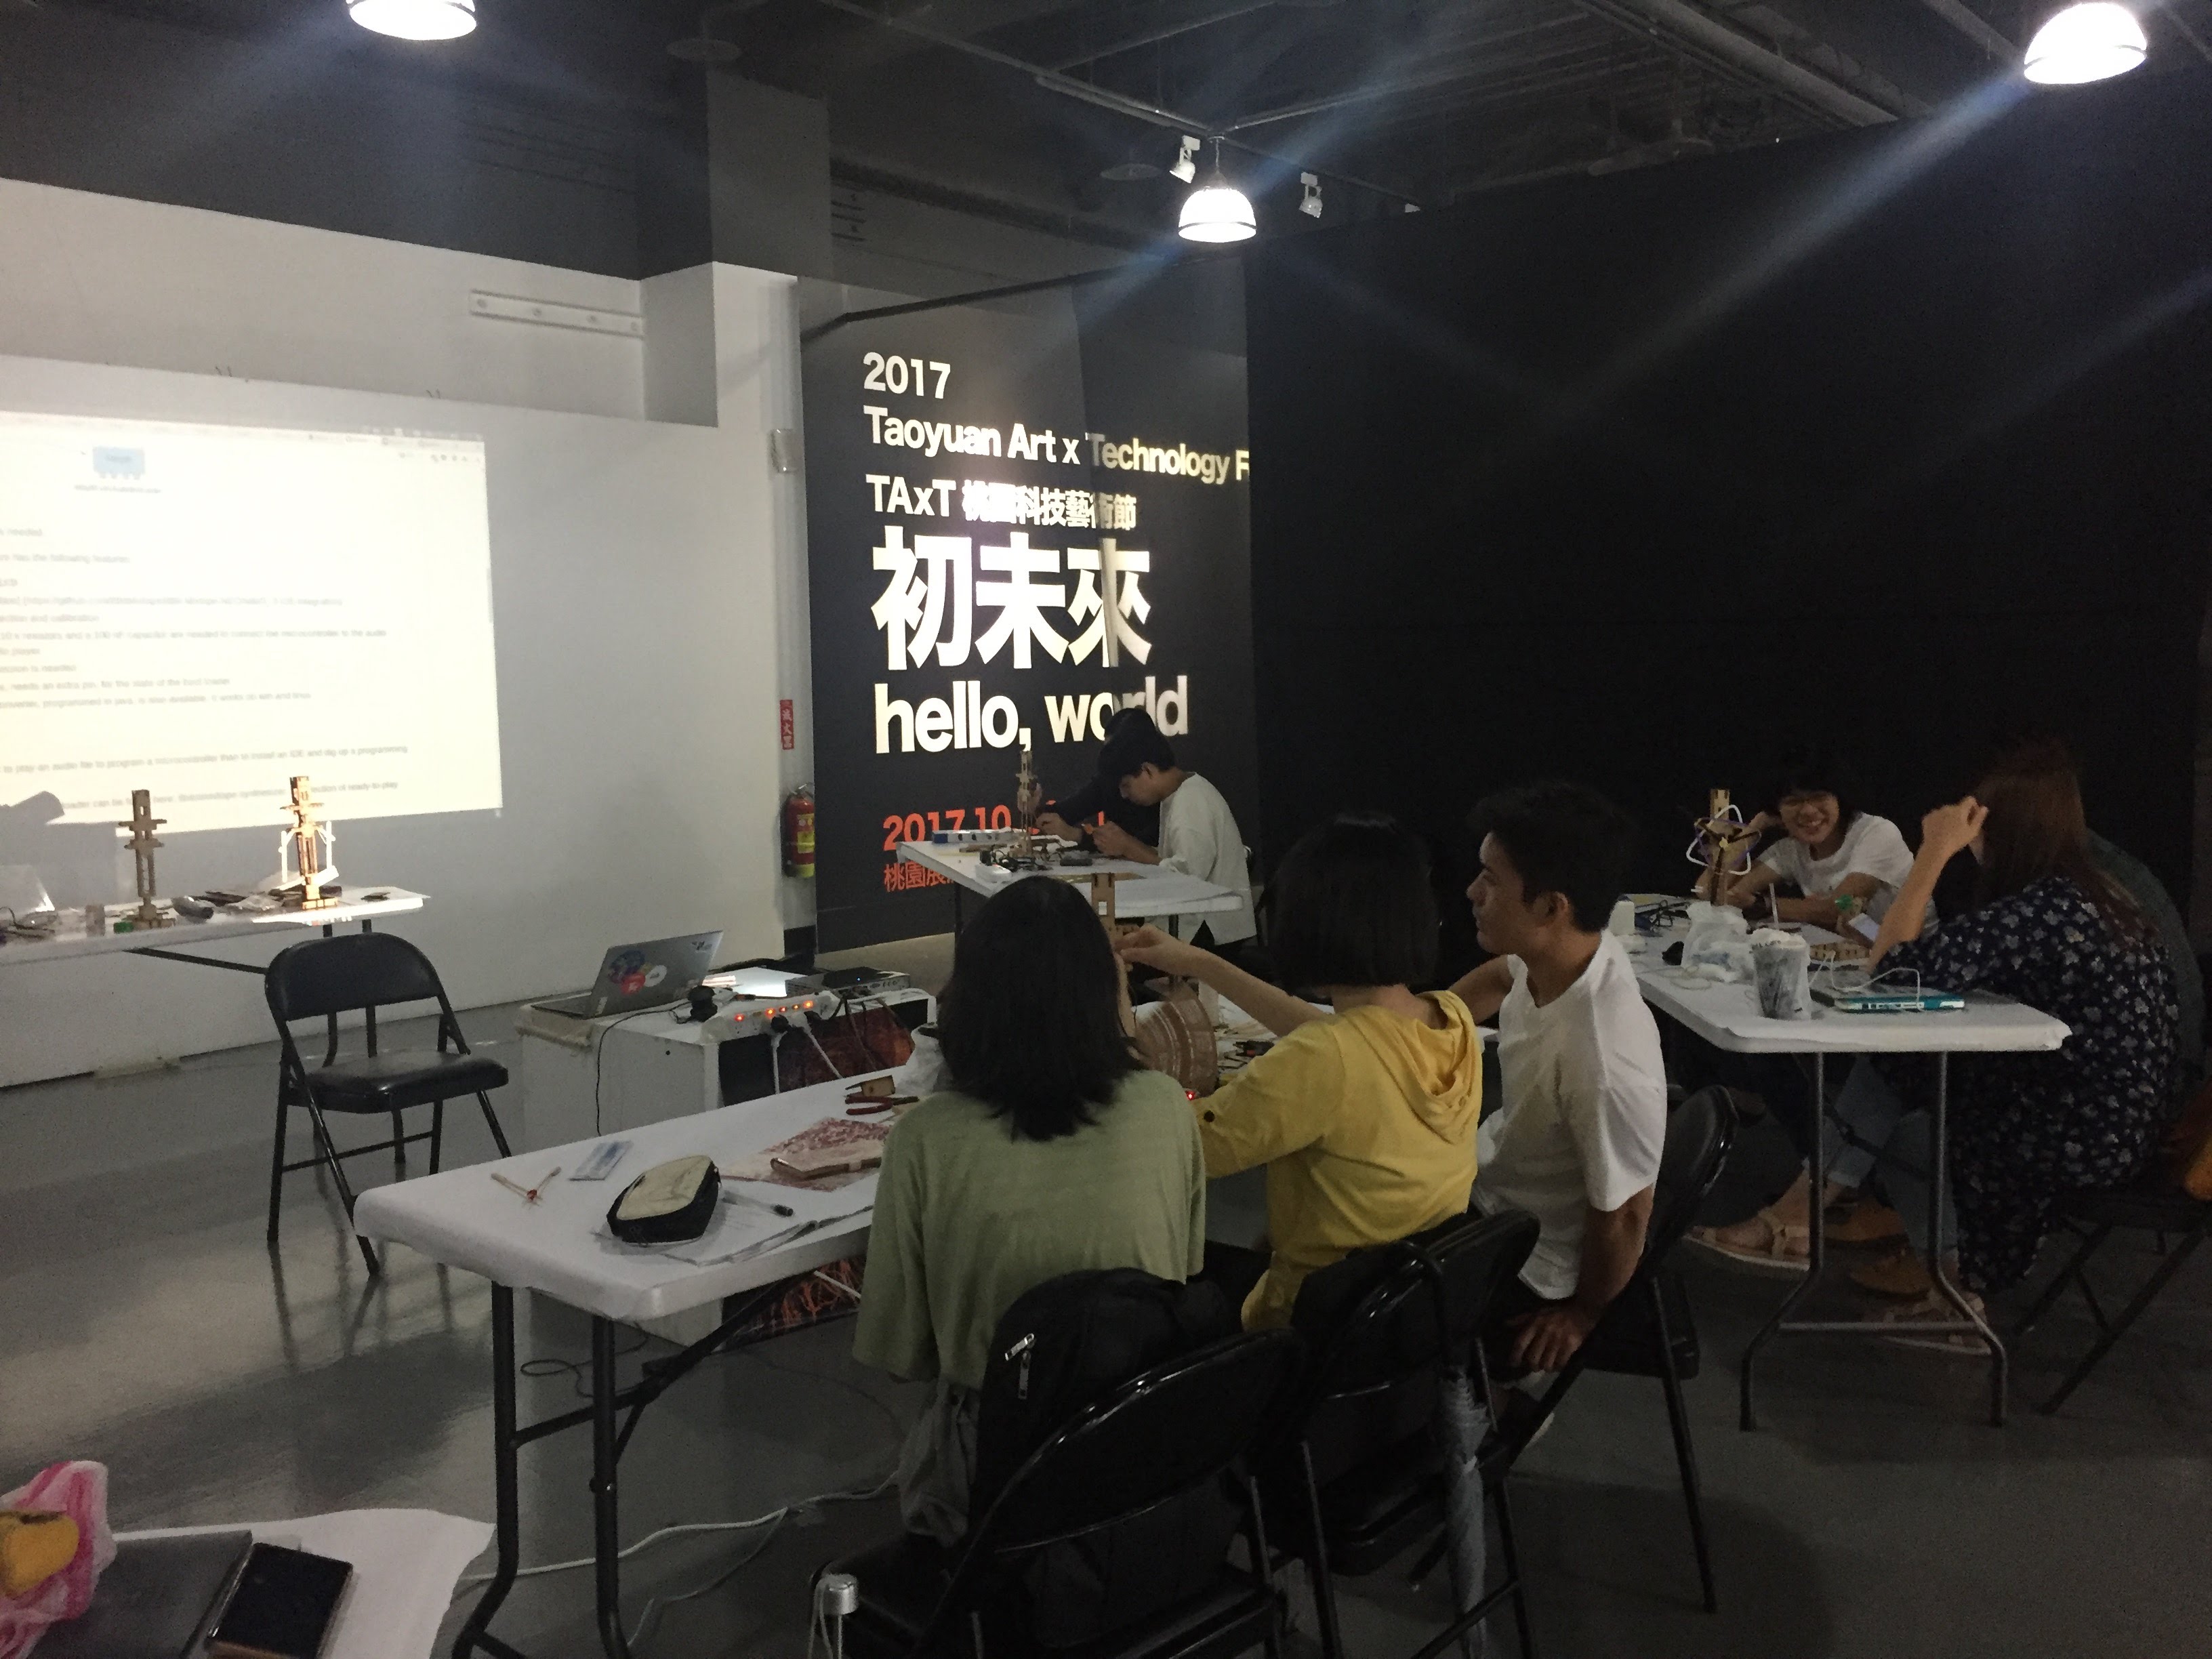
- At: Taoyuan Art x Technology festival, Taiwan
- By: Tuomo Tammenpää
- For: Dimension Plus
- In: October 2017
Information visualisation is a method for understanding abstract data using graphical representation. Most often this is done via printed graphs and charts or as animations on a computer screen. With some creative use of microcontrollers, servomotors and other actuators, we can make physical and kinetic represntations of chosen data. Maybe even understand the changes over time in the data better. In Dancing Data -workshop, we will do few experiments with sensor data translated to motion and make a kinetic sculpture that will perform information physicalisation for us.